

Data Related to SDGs
Environment
CO2 emissions (Unit: t-CO2)
| Measurement item | FY2019 | FY2020 | FY2021 | FY2022 | FY2023※ | |
| SCOPE1 | Gasoline, LPG, city gas, etc. | 1,663 | 1,792 | 1,818 | 1,676 | 1,559 |
| SCOPE2 | Market standards | 8,100 | 9,143 | 11,219 | 8,233 | 9,341 |
| (Reference: Location standards) | (10,785) | (10,966) | (10,120) | (9,185) | (8,614) | |
| Subtotal | 9,763 | 10,935 | 13,037 | 9,909 | 10,900 | |
| SCOPE3 | Total for figures below | 66,965 | 51,058 | 342,270 | 5,133,488 | 5,607,505 |
| Category 1: Purchased items and services | Stationery, copy paper, subcontracting services, advertising, etc. | 25,908 | 26,810 | 22,731 | 19,329 | 21,183 |
| Category 2: Capital goods | Property, plant, equipment and intangible assets acquired in the relevant fiscal year | 35,559 | 18,315 | 24,775 | 12,479 | 17,215 |
| Category 3: Fuel and energy-related activities not included in SCOPEs 1 and 2 | Gasoline, LPG, city gas, electricity | 1,988 | 2,105 | 2,023 | 1,840 | 1,794 |
| Category 4: Transport, delivery (upstream) | Postal fees | 409 | 375 | 372 | 346 | 378 |
| Category 5: Waste produced from business operations | Waste disposal fees | 675 | 964 | 68 | 72 | 58 |
| Category 6: Business trips | Business trips | 559 | 559 | 560 | 555 | 555 |
| Category 7: Commute by the employed | Commute | 1,307 | 1,329 | 1,330 | 1,316 | 1,316 |
| Category 12: Disposal of purchased goods | Disposal of bank books, PR items | 520 | 601 | 369 | 173 | 176 |
| Category 15: Investment | Listed stocks and corporate bonds | - | - | 290,042 | 205,872 | 211,731 |
| Business loans | - | - | - | 4,891,506 | 5,353,099 | |
| Total | 76,728 | 61,993 | 355,307 | 5,143,397 | 5,618,405 |
- Scope of calculation: The Company, Higo Bank and Kagoshima Bank
- The calculation of CO2 emissions is based on the GHG Protocol and uses the Ministry of the Environment’s Basic Guidelines on Accounting for Greenhouse Gas Emissions Throughout the Supply Chain, Emission Intensity Database Ver.3.3.
- The emission factors in Scope 2 are based on the emission factors by electric utility for the grid electricity of the project location (actual emission factors) as of the most recent date of the calculation.
- Emissions of Scope 3, Categories 8, 9, 10, 11, 13, and 14 were zero.
- Regarding Category 15
[Listed stocks and corporate bonds]
We used the Group's investment balance as of March 31, 2024 and most recent, disclosed data on investees at the time of calculation (CO2 emissions and financial information on a consolidated basis). The calculation ratio of our Group’s investments (based on market value) is 78.0%, and the data quality score by PCAF definition is equivalent to a score of 2.
[Business loans]
From FY2022, we began using the measurement method proposed by PCAF in our calculations. The calculation ratio of our Group's loans is 98.7%, and the data quality score by PCAF definition is equivalent to a score of 4.
In the future, we will promote disclosure through bottom-up analysis by supporting CO2 emission measurement, etc. - Scope 1.2.3 emissions for FY2023 are subject to third-party verification by the Japan Quality Assurance Organization.
Greenhouse Gas Emissions Verification Report (FY2023)
Energy consumption
| FY2019 | FY2020 | FY2021 | FY2022 | FY2023 | |
| Energy usage | 240,378GJ | 254,685GJ | 252,527GJ | 223,859GJ | 195,445GJ |
Track record for environmentally-friendly products
| End of FY2019 | End of FY2020 | End of FY2021 | End of FY2022 | End of FY2023 | |
| Balance of environmentally-friendly loans | ¥108.2 billion | ¥114.9 billion | ¥125.1 billion | ¥141.1 billion | ¥170.8billion |
Social
Initiatives for regional revitalization
| FY2019 | FY2020 | FY2021 | FY2022 | FY2023 | |
| Businesses supported by the Group for start-ups | 251 cases | 254 cases | 252 cases | 387 cases | 363 cases |
| Companies supported by the Group for business succession | 301 cases | 408 cases | 706 cases | 637 cases | 619 cases |
| Number of participants in finance classes | 1,937 people | 267 people | 260 people | 35 people※ | 92 people |
| Donations to local ESG, SDGs | ¥282.6 million | ¥379.5 million | ¥685.7 million | ¥68 million | ¥243.2 million |
- The event was held on a reduced scale due to the spread of novel coronavirus infection.
Matters Related to the Human Resource Development Policy
| FY2019 | FY2020 | FY2021 | FY2022 | FY2023 | ||
| Number of participants (total) | Persons | 7,782 | 6,210 | 7,269 | 18,400 | 15,659 |
| Number of training days (total) | Days | 15,680 | 20,164 | 24,331 | 29,572 | 22,053 |
| Training hours (total) | Hours | 125,440 | 161,312 | 113,813 | 145,997 | 176,426 |
| Days per person | Days/Person | 3.7 | 4.8 | 5.8 | 7.1 | 5.2 |
| Training hours per person | Hours/Person | 29.8 | 38.6 | 27.2 | 35.3 | 42.2 |
| Annual training cost | Millions of Yen | 300 | 102 | 137 | 144 | 199 |
- The Group total includes the Company, Higo Bank, and Kagoshima Bank.
- Various seminars held on holidays are also included in the calculations since FY2022.
- Total number of training days (hours): number of participants × number of training days (× training hours per day)
- Number of training days per person: number of training days (hours) / total number of employees
Matters Related to the Internal Environmental Development Policy
| FY2021 | FY2022 | FY2023 | ||||||||
| Higo Bank |
Kagoshima Bank |
Group total |
Higo Bank |
Kagoshima Bank |
Group total |
Higo Bank |
Kagoshima Bank |
Group total |
||
| Number of new hires (new graduates) | Persons | 95 | 141 | 237 | 81 | 123 | 204 | 78 | 133 | 211 |
| Of which, number of female new hires | Persons | 58 | 109 | 167 | 55 | 87 | 142 | 44 | 94 | 138 |
| Percentage of female new hires | % | 61.1% | 77.3% | 70.5% | 67.9% | 70.7% | 69.6% | 56.4% | 70.7% | 65.4% |
| Number of employees | Persons | 2,184 | 2,126 | 4,312 | 2,170 | 2,098 | 4,270 | 2,180 | 2,020 | 4,205 |
| Of which, number of female employees | Persons | 1,037 | 915 | 1,953 | 1,047 | 922 | 1,970 | 1,058 | 943 | 2,005 |
| Percentage of female employees | % | 47.5% | 43.0% | 45.3% | 48.2% | 43.9% | 46.1% | 48.5% | 46.7% | 47.7% |
| Number of employees in management positions *1 | Persons | 869 | 918 | 1,787 | 875 | 891 | 1,766 | 911 | 938 | 1,850 |
| Of which, number of female employees in management positions | Persons | 223 | 198 | 421 | 236 | 200 | 436 | 274 | 255 | 530 |
| Percentage of female employees in management positions | % | 25.7% | 21.6% | 23.6% | 27.0% | 22.4% | 24.7% | 30.1% | 27.2% | 28.6% |
| Number of managers *2 | Persons | 355 | 308 | 663 | 348 | 299 | 647 | 348 | 314 | 662 |
| Of which, number of female managers | Persons | 44 | 14 | 58 | 46 | 12 | 58 | 52 | 33 | 85 |
| Percentage of female managers | % | 12.4% | 4.5% | 8.7% | 13.2% | 4.0% | 9.0% | 14.9% | 10.5% | 12.8% |
| Number of officers at Executive Officer level or above | Persons | 28 | 26 | 75 | 26 | 27 | 74 | 30 | 27 | 78 |
| Of which, number of female officers | Persons | 1 | 2 | 4 | 1 | 2 | 4 | 2 | 2 | 6 |
| Percentage of female officers | % | 3.6% | 7.7% | 5.3% | 3.8% | 7.4% | 5.4% | 6.7% | 7.4% | 7.7% |
| Number of Directors | Persons | 16 | 15 | 46 | 15 | 15 | 45 | 15 | 15 | 45 |
| Of which, number of female Directors | Persons | 0 | 1 | 2 | 0 | 1 | 2 | 1 | 2 | 4 |
| Percentage of female Directors | % | 0.0% | 6.7% | 4.3% | 0.0% | 6.7% | 4.4% | 6.7% | 13.3% | 8.9% |
| Years of service | Years | 15.4 | 15.2 | 15.3 | 15.5 | 15.9 | 15.7 | 15.5 | 15.6 | 15.5 |
| Of which, male’s | Years | 17.4 | 17.5 | 17.5 | 17.5 | 18.1 | 17.8 | 17.4 | 17.9 | 17.6 |
| Of which, female’s | Years | 13.2 | 12.2 | 12.7 | 13.4 | 13.1 | 13.3 | 13.7 | 12.9 | 13.3 |
| Engagement score *3 | P | 70 | 72 | 71 | 70 | 74 | 72 | 71 | 73 | 72 |
| Male childcare leave acquisition rate *4 | % | 100% | 100% | 100% | 100% | 100% | 100% | 100% | 100% | 100% |
| Gender wage gap between full-time male and female employees *5 | % | - | - | - | 64.6% | 53.0% | - | 61.6% | 55.2% | - |
| Youth turnover rate *6 | % | - | - | - | 21.7% | 26.0% | - | 20.8% | 24.2% | - |
| Medical checkup percentage | % | 100% | 100% | 100% | 100% | 100% | 100% | 100% | 100% | 100% |
| Percentage of employees who received specific health guidance | % | 56.1% | 85.5% | - | 61.1% | 83.3% | - | 84.3% | 84.0% | - |
| Reexamination percentage | % | 96.8% | 45.8% | - | 98.6% | 41.4% | - | 97.8% | 74.6% | - |
| Percentage of employees with high stress | % | 6.5% | 4.4% | - | 6.9% | 3.7% | - | 8.5% | 4.2% | - |
| Number of long-term absentees / employees on leave(physical health) | Persons | 14 | 8 | 22 | 14 | 10 | 24 | 20 | 11 | 31 |
| Number of long-term absentees / employees on leave(mental health) | Persons | 32 | 26 | 58 | 37 | 18 | 55 | 34 | 24 | 58 |
| Paid leave acquisition rate | % | 74.6% | 79.3% | - | 83.1% | 78.9% | - | 83.3% | 78.8% | - |
| Number of work-related incidents | Cases | 25 | 11 | 36 | 25 | 14 | 39 | 30 | 11 | 41 |
- The Group total includes the Company, Higo Bank, and Kagoshima Bank.
- Employees in management positions: Employees in chief positions or above and managers.
- Managers: Non-union employees at the manager level or above, regardless of title.
- The Group uses "Wevox" from Atrae, Inc. for measurement.
- Percentage of male employees who took childcare leave within the specified period after their spouses, who are eligible for the childcare leave system, gave birth.
- Ratio of the average wage of full-time female employees to the average wage of full-time male employees
- Youth turnover rate: Turnover rate of new graduate hires within five years of entering the bank
Governance
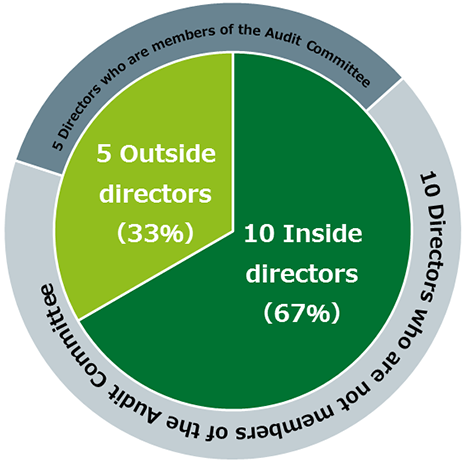
Composition of the Board of Directors (as of the end of June 2024)
Attendance at Board of Directors' Meetings and Committee Meetings(FY2023)
| Board of directors | Audit and Supervisory Committee | Nominating and Remuneration Committee | ||
| Inside director | Sumihiro Matsuyama | ○ Attendance at 11/12 meeting |
○ Attendance at 5/5 meeting |
|
| Yoshihisa Kasahara | ○ Attendance at 12/12 meeting |
○ Attendance at 5/5 meeting |
||
| Eiichi Eto | ○ Attendance at 12/12 meeting |
|||
| Norihisa Akatsuka | ○ Attendance at 12/12 meeting |
|||
| Hiroyuki Tanaka | ○ Attendance at 2/2 meeting |
|||
| Yasunari Iwatate | ○ Attendance at 2/2 meeting |
|||
| Kuniaki Matsumae | ○ Attendance at 10/10 meeting |
|||
| Riichiro Tada | ○ Attendance at 10/10 meeting |
|||
| Takahiro Kai | ○ Attendance at 12/12 meeting |
|||
| Motohiro Kamimura | ○ Attendance at 12/12 meeting |
|||
| Yuichi Tanabe (Audit and Supervisory Committee Member) |
○ Attendance at 12/12 meeting |
○ Attendance at 12/12 meeting |
||
| Masahide Kitanosono (Audit and Supervisory Committee Member) |
○ Attendance at 12/12 meeting |
○ Attendance at 12/12 meeting |
||
| Outside director | Katsuaki Watanabe | ○ Attendance at 12/12 meeting |
○ Attendance at 5/5 meeting |
|
| Yuji Nemoto | ○ Attendance at 12/12 meeting |
|||
| Kenichi Sekiguchi (Audit and Supervisory Committee Member) |
○ Attendance at 2/2 meeting |
○ Attendance at 2/2 meeting |
○ Attendance at 2/2 meeting |
|
| Katsuro Tanaka (Audit and Supervisory Committee Member) |
○ Attendance at 11/12 meeting |
○ Attendance at 12/12 meeting |
○ Attendance at 5/5 meeting |
|
| Yuko Tashima (Audit and Supervisory Committee Member) |
○ Attendance at 12/12 meeting |
○ Attendance at 12/12 meeting |
||
| Nobuya Suzuki (Audit and Supervisory Committee Member) |
○ Attendance at 10/10 meeting |
○ Attendance at 10/10 meeting |
○ Attendance at 3/3 meeting |
|
- Hiroyuki Tanaka, Yasunari Iwatate, and Kenichi Sekiguchi retired as directors at the conclusion of the 8th General Meeting of Shareholders held on June 16, 2023, as their term of office ended. The numbers of meetings held and attended are the number of those held in the concerned fiscal year before their retirement.
- Kuniaki Matsumae, Riichiro Tada, and Nobuya Suzuki were appointed as committee members in June 2023. The number of meetings held and number of meetings attended are those after their appointment.